Reports and Dashboard
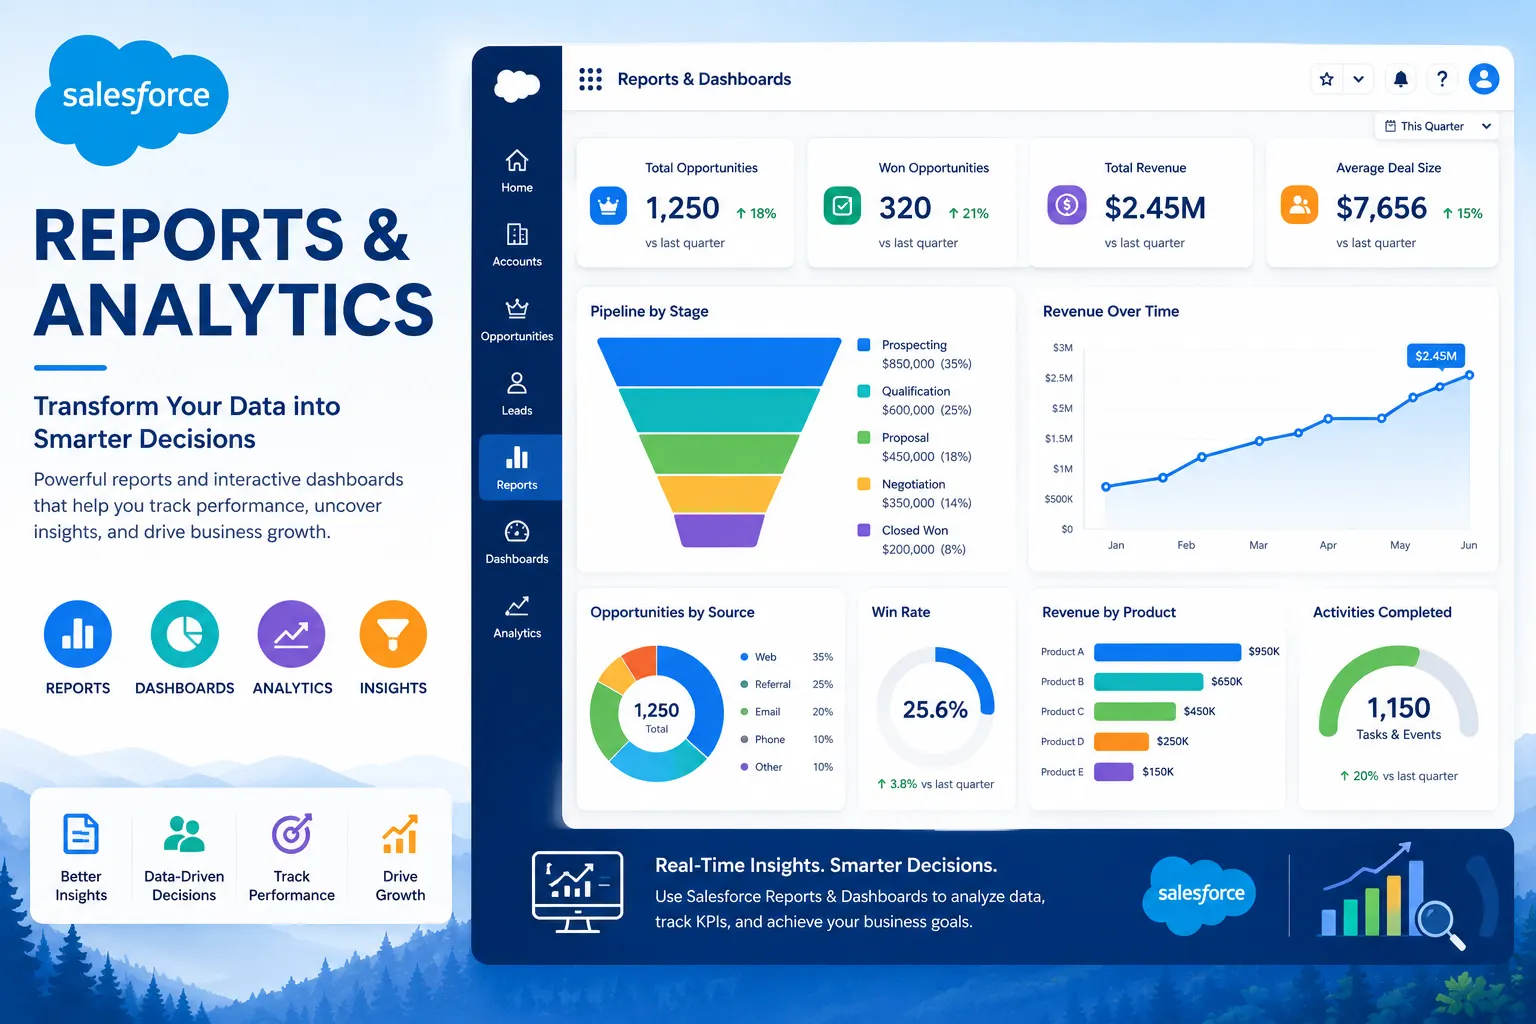
Reports & Analytics in Salesforce CRM
Reports & Analytics play an important role in Salesforce
by helping businesses analyze data, track performance, and make better
decisions. Reports provide structured business data, while dashboards display
the same information visually using charts, graphs, and KPIs. This helps
managers and teams monitor sales, customer support, and overall business
performance in real time.
Reports
Reports are used to organize and display Salesforce data in
a structured format. They help users analyze records related to Accounts,
Contacts, Opportunities, Cases, and other objects.
Reports can display data in:
- Tabular
format
- Summary
format
- Matrix
format
Users can also apply filters, grouping, and calculations to
better understand business performance.
Example
A support manager creates a report to track all open cases
grouped by priority and assigned agent. This helps identify which agents are
overloaded and improves workload distribution.
Business Benefits
- Better
business visibility
- Improved
decision-making
- Easy
performance tracking
- Faster
issue identification
Report Types
Report Types define which objects and fields are available
while creating reports. They determine how related data from multiple objects
can be combined.
There are two main types of report types:
- Standard
Report Types
- Custom
Report Types
Standard Report Types
These are provided by Salesforce by default.
Example:
- Accounts
with Contacts
- Opportunities
with Products
Custom Report Types
These are created when standard report types do not fulfill
business requirements.
Example
A company wants to generate a report showing Cases along
with related Account and Contact information. Since the standard report type
does not provide all required fields, a custom report type called “Cases with
Accounts and Contacts” is created. This gives support teams a complete customer
view in a single report.
Creating Reports
Creating reports involves selecting data and organizing it
for business analysis.
While creating reports, users generally define:
- Report
Type
- Filters
- Columns
- Grouping
- Summary
Calculations
Example
A support manager creates a report to show all open cases
from the last 30 days and groups them by priority and assigned agent. This
helps track workload distribution and identify delayed cases.
Business Benefits
- Better
monitoring of operations
- Improved
productivity tracking
- Real-time
business insights
Filters & Grouping
Filters and Grouping help users refine and organize report
data for better analysis.
Filters
Filters control which records appear in the report based on
conditions such as:
- Status
- Priority
- Date
Range
- Owner
Grouping
Grouping organizes records into categories based on fields
like:
- Agent
Name
- Case
Priority
- Status
Example
A support manager filters the report to display only open
cases from the last 30 days and groups the data by priority and assigned agent.
This helps identify workload imbalance and SLA risks.
Summary vs Tabular Reports
Tabular Reports
Tabular reports display records in rows and columns similar
to an Excel sheet. They are mainly used for simple data listing.
Example
A report displaying all open cases with Case Number, Status,
and Priority in table format.
Summary Reports
Summary reports allow grouping and calculations such as
count, average, and total.
Example
A report grouped by Assigned Agent showing how many cases
each agent is handling. This helps managers monitor team performance.
Dashboards
Dashboards provide graphical representations of business
data using reports. They help managers and executives monitor KPIs and trends
in real time.
Dashboards can display:
- Charts
- Graphs
- Tables
- Gauges
- Metrics
Example
A support dashboard displays:
- Total
open cases
- Cases
resolved today
- SLA
breach cases
- Average
response time per agent
This helps managers quickly identify service issues and
improve team performance.
Business Benefits
- Real-time
monitoring
- Faster
decision-making
- Better
business visibility
- Improved
operational efficiency
Dashboard Components
Dashboard Components are individual visual elements inside a
dashboard. Each component displays a specific KPI or business metric.
Common dashboard components include:
- Pie
Charts
- Bar
Charts
- Gauges
- Metrics
- Tables
Example
A support dashboard contains:
- Pie
chart for cases by priority
- Gauge
for SLA compliance
- Metric
showing total open cases
- Table
showing top agents with highest workloads
This allows managers to monitor business performance at a
glance.
Dynamic Dashboards
Dynamic Dashboards display data based on the logged-in
user’s access and security permissions.
Unlike standard dashboards, dynamic dashboards automatically
show relevant data for each user without creating multiple dashboards.
Example
When a support agent opens the dashboard, they see only
their assigned cases. When a support manager opens the same dashboard, they can
see all team cases and performance metrics.
Business Benefits
- Personalized
user experience
- Better
security
- Reduced
maintenance effort
- Role-based
visibility
Sales & Service Metrics
Sales & Service Metrics are KPIs used to measure the
performance of sales and support operations.
Sales Metrics
Examples:
- Revenue
Generated
- Opportunities
Closed
- Conversion
Rate
- Pipeline
Value
Service Metrics
Examples:
- Average
Resolution Time
- SLA
Compliance
- Customer
Satisfaction
- Open
Cases Count
Example
A company uses Salesforce dashboards to monitor opportunity
conversion rates, case resolution time, and SLA compliance. When SLA compliance
drops below the target, managers investigate workload issues and improve
support operations.
Conclusion
Reports & Analytics in Salesforce help organizations
transform raw data into meaningful business insights. Reports provide
structured data analysis, while dashboards offer real-time visual monitoring of
KPIs and performance metrics. By using reports, dashboards, filters, grouping,
and dynamic analytics, businesses can improve decision-making, productivity,
customer service, and overall operational efficiency.